Exploring Right-Sizing Recommendations
It can take up to 7 days for Optimize Live to generate optimal recommendations for your workloads
Optimize Live - Overview
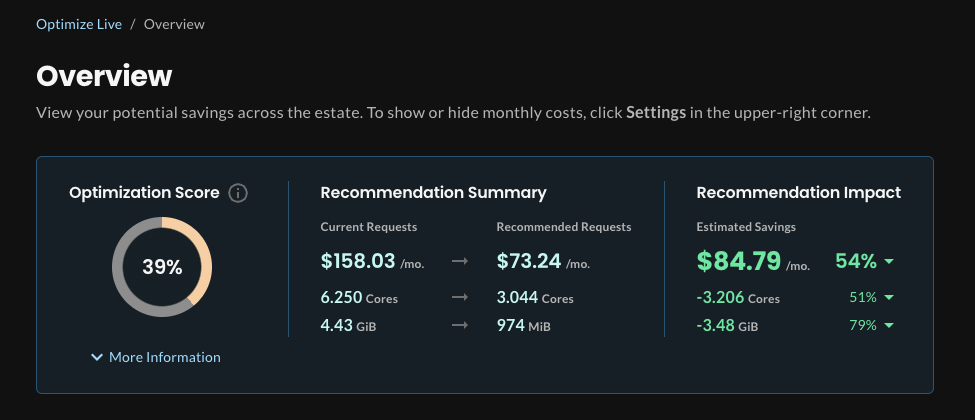
After deploying the StormForge Agent and the initial 1 hour has passed, the StormForge Optimize Live UI will show an Overview page, highlighting:

- The Optimization Score of the total number of clusters running the StormForge Agent
- A summary of the right-sizing Recommendations made across all workloads
- A summary of the Recommendation Impact of applying all recommendations across all workloads
Optimize Live - Workloads
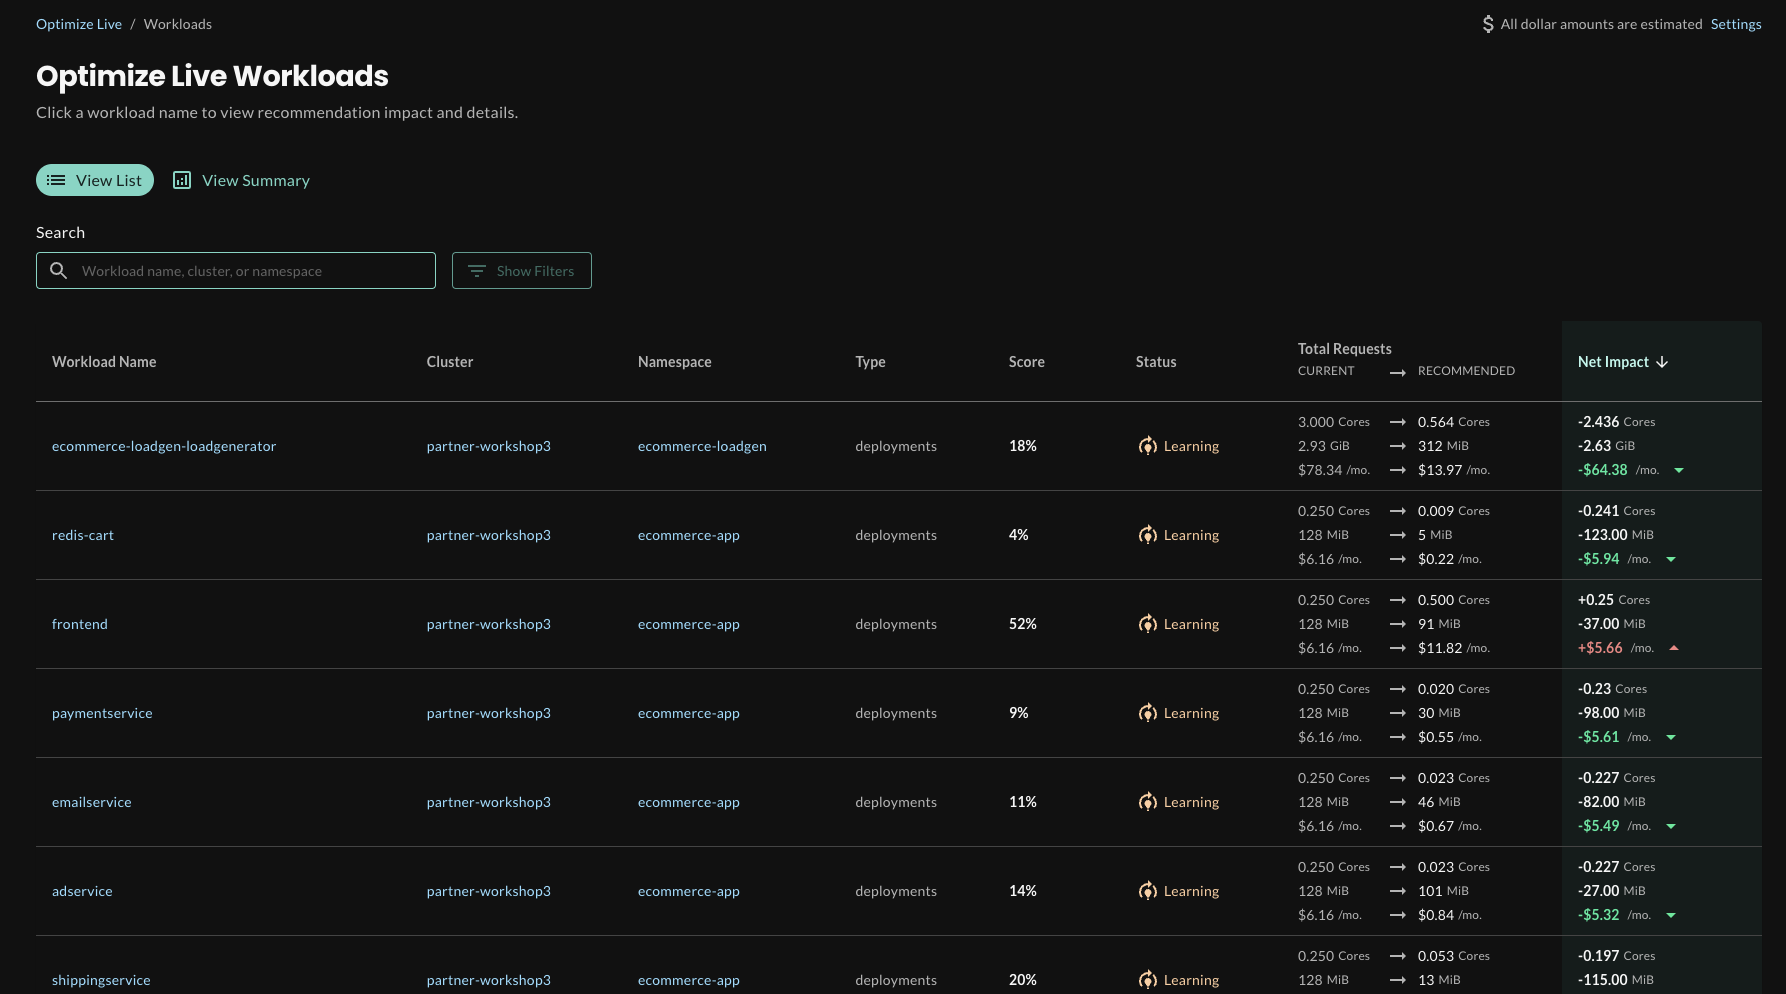
From the Overview page, you can click the Workloads icon on the left navigation to view a list of all workloads being analyzed by Optimize Live:

Workloads will be ranked by Net Impact - a value which is calculated from the difference between a workload’s current resource requests and Optimize Live’s recommendation for its resource requests.
Optimize Live - Workload Details
You can click on any workload to get specific details about that workload’s current configuration, resource usage metrics, and right-sizing recommendations.

Here, you can see:
- Current Total Requests for both CPU and Memory
- Projected Total Requests for both CPU and Memory With Optimization
- The current Optimization Score
- The current state of the Recommendation (in this case, it is listed as preliminary because the initial 7 day learning period has not been completed)
Optimize Live - Workload Recommendation Details
As we scroll down the Workload Details page, we can see the Recommendation Details.

In the case of the sample app we deployed earlier in this workshop, you can see that Optimize Live is recommending an increase of CPU Requests (from 500m to 575m) along with a reduction in Memory Requests (from 128MiB to 12MiB).
Optimize Live - Workload Recommendation Patches
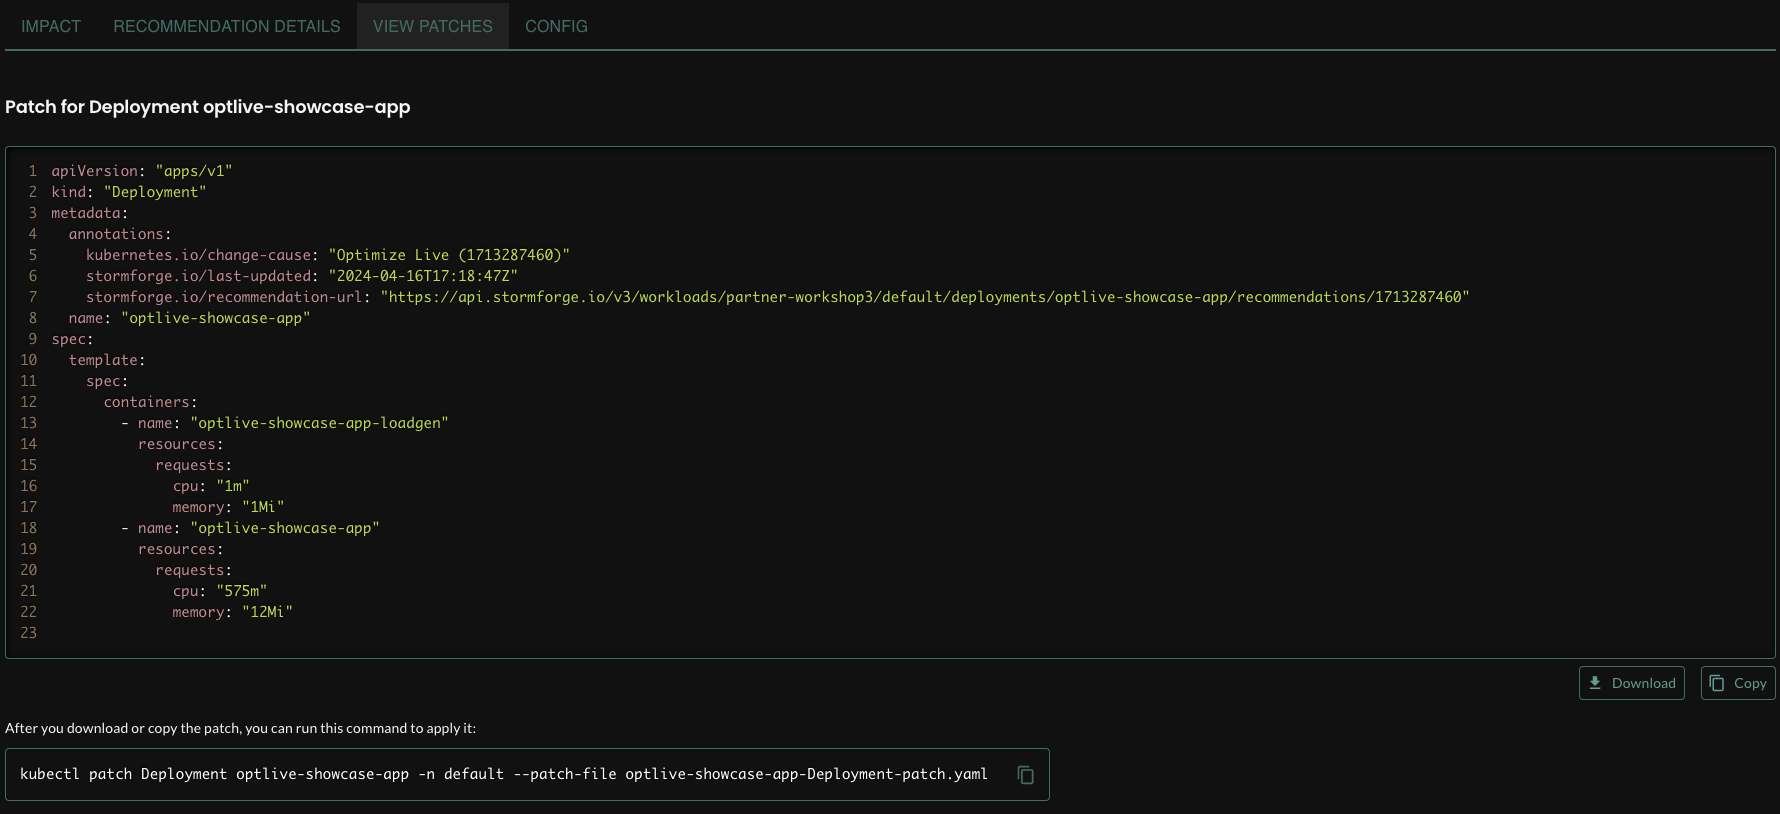
Beyond simply analyzing workload resource usage metrics and making right-sizing recommendations, Optimize Live also provides a comprehensive set of patches that can be applied to your workloads directly using either kubectl, the StormForge Applier, or they can be integrated into a deployment pipeline.

From here, you can download the patch to a local directory and you can use the preformatted kubectl command to apply the patch:
kubectl patch Deployment appname -n default --patch-file appname-Deployment-patch.yaml
Or we can use the StormForge Applier to apply this patch and any others with a single click.
Next: Deploy the StormForge Applier
Proceed to the next section to deploy the StormForge Applier